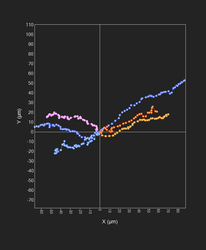
Directional plot, or Migration plot, is one of the charting options available in the Charts Panel. It is the default charting option for all data with a time component.
It aligns the starting position of all selected track objects to the origin and plots their X and Y positions relative to the origin over time. This chart is very useful for finding track migration patterns.
To display the Directional plot, open the Charts Panel and select the Directional plot option  from the Charts selection dropdown menu.
| Panel | |
|---|---|
On this page:
|
General usage
Select measurements
There are no measurements to select with the Direction Plot. The charts plots the relative X and Y position of selected tracked objects.
Select objects
Objects cannot be selected directly from this chart and instead must be selected by clicking on the desired object or objects on the image, or in the Spreadsheet. If no objects are selected in the image, the chart will display all tracks in the image.
Context menu options
You can bring up the context menu by right-clicking anywhere in the Charts Panel. The context menu is specific to the Directional plot and can be used to adjust chart display options.
| Name | Description |
|---|---|
| Color | Lets you select how to color the objects in the Directional Plot; there are two options:
|

Related articles
| Filter by label (Content by label) | ||||||||||||||||||
|---|---|---|---|---|---|---|---|---|---|---|---|---|---|---|---|---|---|---|
|
| Page Properties | ||
|---|---|---|
| ||
|