Aivia Software
Lineage plot
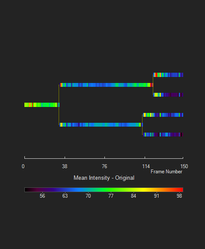
Lineage Plot is one of the charting options available in the Charts Panel. It displays a single selected track and its lineage tree. The plot uses a simple graphic to show when a tracked object has split into two objects. The selected track's lineage tree is plotted horizontally with time on the x-axis.
To display the Lineage plot, open the Charts Panel and select the Lineage plot option  from the Charts selection dropdown menu.
Appearance
Each track in the lineage tree is plotted as a single bar. A tooltip about the Track ID will be displayed when you hover over one of the tracks. The tooltip shows the track number, current frame number, and (if selected) measurement value. The currently displayed frame is indicated on the Lineage Plot by a vertical red line with the frame number listed above it. Below the time scale is the measurement and heatmap selector.
On this page:
General usage
Select measurements
Measurements can be selected for coloring the track in the Lineage Plot. Click on the measurement label above the color axis and select from the displayed list. Each time point on the track will be colored differently based on the measurement value at that given time.
Select objects
Objects cannot be selected directly from this chart initially and instead must be selected by clicking on the desired object or objects on the image or the Spreadsheet. Selecting a tracked object will also plot other tracked objects that are part of the same lineage tree. Once the lineage plot is populated, you can select a different tracked object on the displayed lineage by clicking on its corresponding bar on the charts.
Change axis scale
The axis scale is fixed to the total frame length of the entire lineage tree. It is not possible to change either the x- or the y-axis.
Navigate to a time point
You can click anywhere on the Lineage plot itself to navigate directly to that specific time point. Hold down the left mouse button while dragging the cursor to play through the image sequence.
Change heatmap coloring
Right-click on the heatmap to display a list of coloring options for the heatmap. You can choose from a list of pre-defined color schemes or create a new one.