Aivia Software
Flow plot
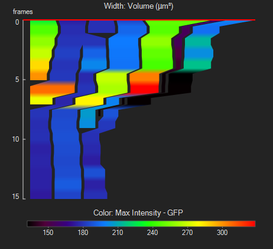
Flow Plot is one of the charting options available in the Charts Panel.
It is an advanced plot for charting tracks and their lineages. The Flow plots allows you tho choose two measurements to display for selected tracks and lineages over time. The Width measurement determines the rendered width of the track per time point based on its value. The Color measurement determines the rendered color of the track per time point. Divisions are represented by the splits in the Flow plot.
To display the Flow plot, open the Charts Panel and select the Flow plot option  from the Charts selection dropdown menu.
On this page:
General usage
Select measurements
As with all charts, to select a measurement, hover over the measurement name until it turns red and then click to bring up a menu of the available measurements. You can specify a measurement for the width and color of the plot.
Select objects
Objects cannot be selected directly from this chart and instead must be selected by clicking on the desired tracks on the image or in the Spreadsheet.
Navigate to a time point
You can click anywhere on the Trace plot itself to navigate directly to that specific time point.
View measurement
You can view the selected measurement of the plotted object by hovering over the line graph. A tooltip will appear with information about the object , time, the width measurement, and the color measurement.
Context menu options
You can bring up the context menu by right-clicking anywhere in the Charts Panel. The context menu is specific to the Flow plot and can be used to adjust chart display options.
| Name | Description |
|---|---|
| Auto merging | |
| Centering | Toggles center alignment for the selected lineages; by default the lineages are aligned to the left side of the Flow plot |
Show time cursor | Toggles display of the red bar that indicates the current frame position |
| Auto time | Adjusts the scale of the time-axis automatically; there are three options:
|
| Auto width | Adjusts the scale of the width automatically; there are two options:
|
| Auto color | Adjusts the scale of the color range automatically; there are two options:
|
| Colors | Allows you to select the color palette used for the Colors axis |
| Options | Pops up the Options dialog that allows you to set the minimum and maximum values for the time axis as well as the range limits on the width and color of the flow plot |