Aivia Software
Kymograph
Kymograph is one of the charting options available in the Charts Panel. It is a graphical depiction of a defined region on the image and its changes over time. Kymograph creates an image on the chart, with the region's appearance plotted along the x-axis and time along the y-axis.
To display the Kymograph, open the Charts Panel and select the Kymograph option  from the Charts selection dropdown menu.
For detailed information about Kymograph in general, please refer to the Wikipedia entry for Kymograph.
On this page:
Appearance
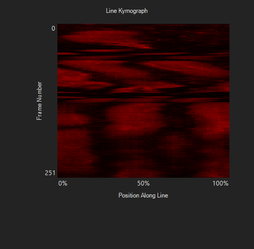
An example of the kymograph plot is shown on the right. Time is plotted along the y-axis in the calibrated units or in frame number if no time calibration is present. Position along the drawn line as a percentage is plotted along the x-axis.
General usage
Select channel
The selector is a dropdown menu that allows the user to pick the channel, or combination of channels, to use when coloring the kymograph.
Draw line
The line tool is automatically enabled when you launch the kymograph chart. Alternatively, you can click on the Line Tool  icon to activate. Draw a line on the image by holding down the left mouse button and dragging the cursor. Release the left mouse button to finish the line.
The line is overlaid on the image in white and contains an arrow on one end, indicating the 100th percentile position on the kymograph's x-axis.
Clear line
Drawing a new line on the image will replace the existing kymograph with a new one based on the line drawn. To clear a line, click on the Clear kymograph line  icon. This action will remove the existing kymograph overlay.
Kymograph settings
Next to the Channels selector dropdown menu is the Kymograph settings, indicated by a gear icon. Click on the icon to launch the kymograph settings dialog. There are six options:
| Name | Description |
|---|---|
| Channel mode | Specifies the channel selection mode for creating the kymograph; there are two options:
|
| Color mode | Specifies how the channel color information is used for each channel when creating the kymograph
|
Number of samples | Sets the number of samples along the x-axis. Increasing the number of samples will increase the number of data points along the x-axis. If the number of samples specified is longer than the length of the drawn line, then the kymograph will set the maximum number of samples equivalent to the total number of pixels along the length of the line. |
| Sample width | Set the width in number of pixels sampled along the line when creating the kymograph; intensities of all pixels within the sample width are averaged |
| Sample mode | Toggles option to interpolate the missing data points when high sample rate is used in conjunction with a short drawn line. There are two sampling modes:
|
| Smoothing | Applies smoothing on the kymograph image along the time axis |
|
| Kymograph overlay |
