Parameters and Presets
Parameters
Recipe parameters for Colony Analysis and their descriptions are summarized in the table below.
| Preset Group | Parameter Name | Min Value | Max Value | Description |
|---|---|---|---|---|
| Colony Detection | Colony Detection Sensitivity | 0 | 255 | Adjusts the sensitivity of the detection; a lower value will detect bigger and more objects; the MEF substrate and Matrigel substrate options let you select different detection routines depending on your plating substrate |
| Colony Refinement | Minimum Colony Area | 0 | 1,000,000,000000 (px2 or µm2) | Specifies the minimum size for objects to be included in the analysis results based on the area of the detected objects |
| Fill Holes SizeArea | 0 | 1,000,000000 (px2 or µm2) | Adjusts the maximum size threshold for filling in gaps inside a detected object; a lower value will preserve more holes in the detection | |
| Smoothing Factor | 0 | 100 | Adjusts the amount of smoothing applied to the outline of the detected objects; a lower value will preserve more of the object's morphological features |
Tutorial
Before beginning the tutorial, please download the Colony Analysis Demo image. For information on how to select presets or modify parameter values, please refer to the tutorial on how to use the Recipe Console.
- Unzip the demo file and load the demo image, ColonyDemo.tif, into Aivia
- In the Recipe Console, click on the Recipe selection dropdown menu and select the Colony Analysis recipe
- Select the Low preset for the Colony Detection group and the Medium preset for the Colony Refinement group
- Click on the caret
 to the left of the Colony Refinement preset group to show the preset parameters
 - Modify the parameter values as follows, leaving the other parameters intact:
- Minimum Colony Area: 25,000
- Click the Start button or press the F4 key on your keyboard to begin applying the recipe to the image
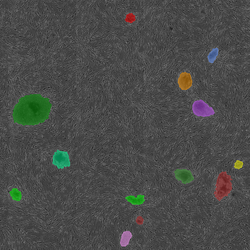
The detected objects outline and tracks will be overlaid on the image.
Results
|
| Colony Analysis results |
Related articles
| Filter by label (Content by label) | ||||||||||||||||||
|---|---|---|---|---|---|---|---|---|---|---|---|---|---|---|---|---|---|---|
|
| Page Properties | ||
|---|---|---|
| ||
|