Versions Compared

Key

  • This line was added.
  • This line was removed.
  • Formatting was changed.

The Graphical User Interface (GUI) of Aivia is shown below:

Image Modified

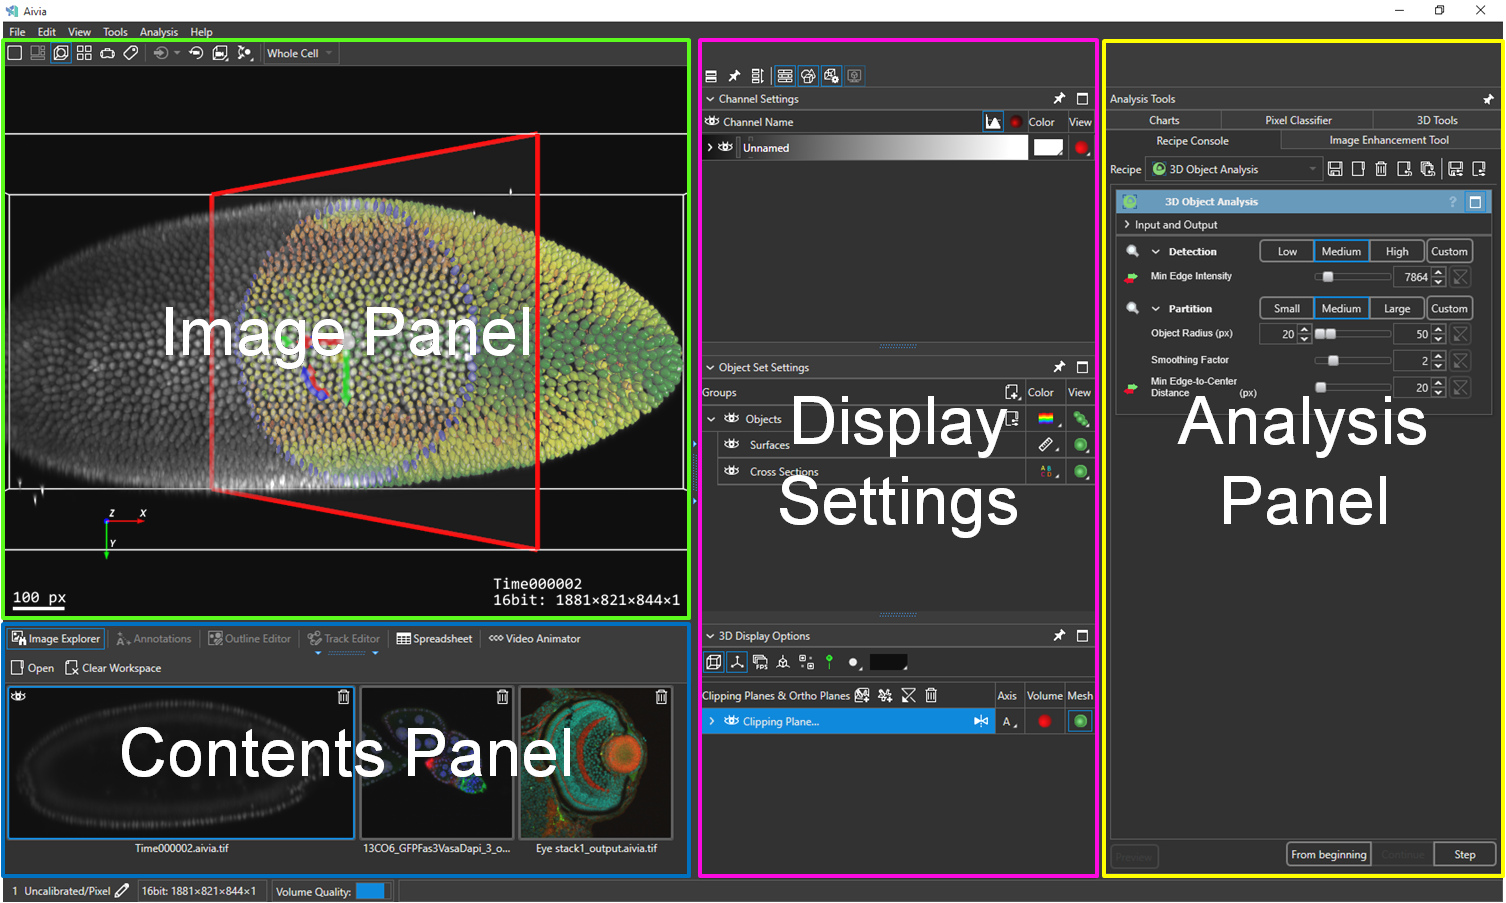
The GUI is split into four sections:

  • Image Panel
  • Contents Panel
  • Display Settings
  • Analysis Panel

Each section offers different tools and functionalities for visualization, analysis and editing.


Panel

On this page:

Table of Contents


Image Panel

The Image Panel is the primary area for displaying the field of view (FOV) of the image and objects contained within the image. The Image Panel provides zoom control buttons for manipulating the display of the FOV in the zoombar. You can adjust the appearance of the displayed image and objects using the Display Settings panels to the right of the image. There are five modes of display that can be accessed via the zoombar:

  • 2D view shows the displayed image in 2D; for multi-dimensional images, you can navigate to a different time point (T) or plane (Z) using the T/Z bar below the image
  • Gallery view allows you to examine individual 2D objects in a thumbnail gallery
  • 3D view shows the displayed image in 3D; this option is only available when there is more than one Z-plane on the image
  • 3D plane view shows an XY-, YZ-, and XZ-plane of the image as well as a 3D view simultaneously; this option is only available when there is more than one Z-plane on the image
  • VR view shows the displayed image in Virtual Reality (VR) space; while this mode is active, you will not be able to interact with the displayed image in the Image Panel
  • Classifier view lets you create and apply custom classification on analyzed data (such as objects and surfaces)

You can interact with the image directly by moving your mouse cursor to the image and using the mouse to manipulate the display. For more information, please refer to the document on mouse interactions.


Contents Panel

The Contents Panel consists of several major features for displaying contents, editing and video export. It can be resized vertically by dragging the blue dotted handle near the top middle of the panel, or collapsed/expanded by clicking once on the same handle. Some features are unavailable in different view modes. Alternately, you can open the panel by clicking on the button for a specific tool to open that particular feature.

There are six tools for the Contents Panel:

  • Image explorer displays thumbnails of the images you have loaded into Aivia and lets you switch between the loaded files
  • Annotations provides a set of on-screen tools for manually measuring the displayed image in 2D view
  • Outline editor lets you create and edit the outline of select objects in 2D view
  • Track editor lets you edit track objects, modifying the relationship between tracks and track points over time
  • Spreadsheet displays the measurement data for recipe-generated or manually-created objects and object sets
  • Video animator lets you create and export flythrough videos in 3D view by capturing individual keyframes containing information about the current display


Display Settings

The Display Settings panels control the display for channels, objects and other display overlays on the image. By default, the three Display Settings panels are not pinned and are in a column to the right of the image. You can adjust how the loaded image appears in the Image Panel using the options provided in this section - operations such as visibility, contrast and rendering mode.

There are three Display Settings panels:

  • Channel settings lets you adjust the visibility, contrast, brightness, color and rendering mode of the channels on the loaded image
  • Object set settings lets you adjust the visibility, color and display style of objects and tracks on the loaded image
  • 3D display optionsDisplay Options lets you control how the 3D scene appears in the Image Panel; this panel includes a section for clipping planes and ortho planes
    • Clipping planes and ortho planes& Ortho Planes lets you add clipping planes or ortho slices to the 3D display to hide parts of the rendered volume or objects


Analysis Panel

The Analysis Panel consists of several tools for analyzing the displayed image - automatically via recipes or manually through editing. By default, the Analysis Panel is pinned and makes up the far-right column of the Aivia window. Depending on the view mode, different tools may be available.

There are five tools for the Analysis Panel:

  • Recipe console is the default displayed tool that allows you to select an automated image processing and analysis pipeline (called "recipes") to run on an image
  • Image enhancement tool allows you to select an image processing pipeline to enhance an image
  • Charts lets you plot the analysis results graphically with a variety of display options
  • Pixel classifier lets you enhance an image using DRVISION's patented machine learning technology for content-aware enhancement of image features
  • 3D tools provides a suite of functions for manual editing and manipulating the display in 3D view


Panel viewing controls

You may resize panels using the blue dotted handles. Click on the blue dotted handles that have blue arrows to hide/reveal panels. You can also hide panels by holding down Shift while mousing over a boundary between the Image Panel and another panel.

The Display Settings panels and Analysis Panel each have an icon near the upper-right corner that indicates whether the panel is pinned  or unpinned ; click on this Pin icon to (un)pin the panel. If a panel is not pinned, click on the Maximize icon in the upper-right corner of the panel to fully expand the panel. You may also click on the caret next to the header of an unpinned panel to expand/collapse the panel.

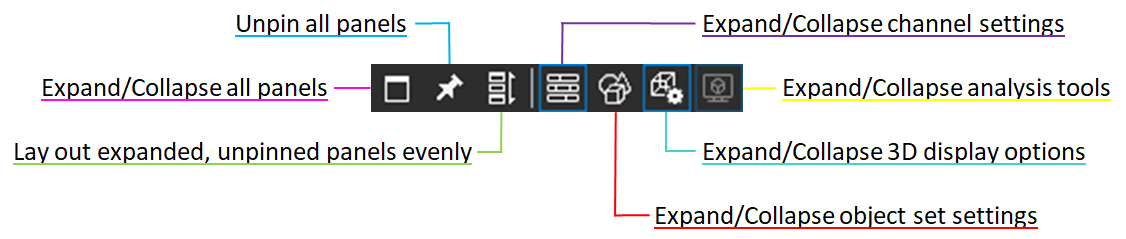
Additionally, there is a set of controls located above the leftmost of the Display Settings panels and Analysis Panel. The figure below describes these options. You may middle-click on any of the expand/collapse icons for individual panels to maximize those panels. The expand/collapse icons for pinned panels are grayed out, and the expand/collapse icons for expanded panels are outlined in blue. 


Image Modified

Panel control bar


Filter by label (Content by label)
showLabelsfalse
max5
spacescom.atlassian.confluence.content.render.xhtml.model.resource.identifiers.SpaceResourceIdentifier@836
showSpacefalse
sortmodified
reversetrue
typepage
cqllabel in ( "getting-started" , "tutorial" ) and type = "page" and space = "AW"
labelsgetting-started tutorial


Page Properties
hiddentrue


Related issues