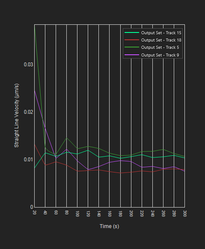
Trace Plot is one of the charting options available in the Charts Panel. It is the default charting option for all data with a time component. It displays a measurements for selected objects over time. The measurement value is plotted on the y-axis and time on the x-axis. Trace Plot can display data from multiple objects simultaneously. The chart will autoscale to accommodate display of all selected data.
To display the Trace plot, open the Charts Panel and select the Trace plot option  from the Charts selection dropdown menu.
For detailed information about Trace Plot in general, please refer to the Wikipedia entry for Line Chart.
On this page:
General usage
Select measurements
As with all charts, to select a measurement, hover over the measurement name until it turns red and then click to bring up a menu of the available measurements. Only the y-axis measurement can be specified in this chart.
Select objects
Objects cannot be selected directly from this chart and instead must be selected by clicking on the desired object or objects on the image.
Change axis scale
To change the scale on any axis, click on the minimum or maximum value displayed and that value will appear in an editable window. Type in the value desired for the axis and hit Enter. Repeat this for other endpoint value as needed.
Navigate to a time point
You can click anywhere on the Trace plot itself to navigate directly to that specific time point. Hold down the left mouse button while dragging the cursor to play through the image sequence.
View measurement
User can view the selected measurement of the plotted object by hovering over the line graph. A tooltip will appear with information about the object and time.
Context menu options
You can bring up the context menu by right-clicking anywhere in the Charts Panel. The context menu is specific to the Trace plot and can be used to adjust chart display options.
| Name | Description |
|---|---|
| Normalize | Takes the maximum value displayed and assign that the value of '1' and assign the minimum value displayed the value of zero. All other other values will be placed on this scale relative to these defined maximum and minimum values |
| Time display | Allows you to select an option for displaying how time (x-axis) is displayed in the Trace plot; there are five options:
|
Secondary axis | Adds a second axis to the Trace Plot, which allows more than one measurement to be displayed on the Trace Plot To select a measurement on the secondary axis, hover over the axis label and click to bring up the list of available measurements. |
| Secondary data style | Opens a sub-menu with options to select the line style for the data associated with the secondary axis; there are five options
|
| Trace plot color options | Lets you select how to color the objects in the Trace Plot; there are four options:
|
Related articles