Aivia Software
Histogram
Histogram plot is one of the charts available in the Charts Panel. It presents the data for one object set as a binned distribution.
To display the Histogram plot, open the Charts Panel and select the Histogram option  from the Charts selection dropdown menu.
For more detailed information about histograms in general, please refer to the Wikipedia entry for Histogram.
On this page:
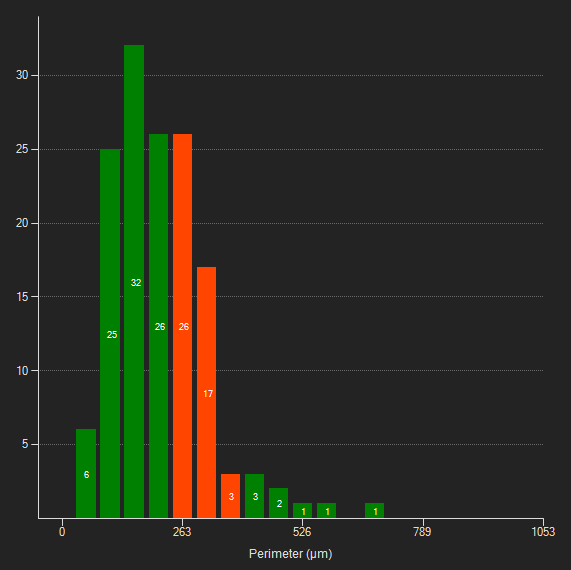
Appearance
Data for the selected measurement is binned and counts are displayed as bars. The number of counts is displayed within the bars. When hovering above a bar, the bin's minimum, maximum and mean are displayed.
General usage
Select measurements
Like other charts, to change the measurement plotted, hover over the measurement name on the x-axis until it turns red and then click to bring up a menu of the available measurements.
Select objects
Clicking on any bar on the Histogram will select these objects on the image and in the spreadsheet. To select multiple bars on the Histogram, hold down the Shift or Ctrl key while clicking on the bars to select. A selected bar is shown in red, and if the measurement changes, the selected objects remain selected and their relative positions on the Histogram are still shown in red.
You can also select a range of bars by holding down on the left mouse button while dragging the cursor. This allows you to draw a box around multiple columns on the histogram. Release the mouse button to select.
You can select a bar that is entirely enclosed within the drawn box. Make sure to enclose the area below the x-axis during selection.
Change bin size
To in-/decrease the bin size, use mouse wheel while hovering above the histogram.,
Panning
To pan across the horizontal axis, right-click on the chart and drag.
Context menu options
You can bring up the context menu by right-clicking anywhere in the Charts Panel. The context menu is specific to the Histogram plot and can be used to adjust chart display options.
| Name | Description |
|---|---|
| Trend mode | This option performs a smoothing of the data, allowing the user to visualize trends in the histogram. Due to the smoothing, the actual values may no longer be accurate; as a result, the y-axis will not appear when Trend mode is selected |
| X-axis | This allows you to toggle the x-axis scales between four different options:
|
| Y-axis | This allows you to toggle the y-axis scales between four different options:
|
| Line style | This option changes the chart display from bars to a line connecting the maximum value in each bin |
| Update during play | With this option selected the Histogram will update to display the current frame when playing an image sequence. If deselected, the chart will update during single frame navigation, but will not update while playing an image sequence until the sequence is paused |